Cardiovascular Disease Risk Overview
- Risk estimates are useful in raising population awareness of disease with significant morbidity and mortality such as CVD (cardiovascular disease), and to communicate knowledge about the risk to individuals and subgroups, and motivate people to recommended lifestyle changes or therapies. Such estimates allow individuals and populations to be classified as low risk and high-risk for CVD.1
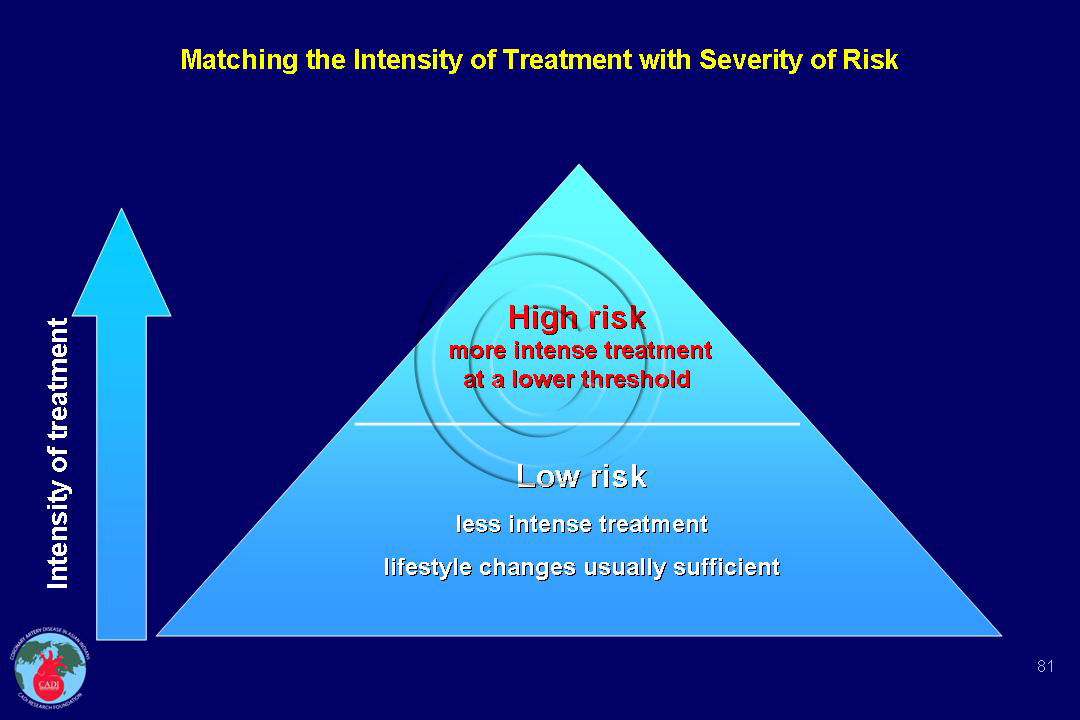
- The risk for an individual within a population is not just a function of their absolute ranking in relation to others but on the overall risk of the population in which they live. A “low-risk” individual in a high-risk population may actually be at higher total cardiovascular disease (CVD) risk than a “high-risk” individual in a low-risk population. For example, a low risk individual in India may have actually higher risk of heart attack than a high risk individual in China. The intensity of treatment should match the severity of risk (Figure 081).2
- The risk of an individual should always be judged in the context of the CVD risk of the population as a whole. An assessment of the determinants of total CVD risk should be a major determinant of priority setting for CVD prevention and management policy at both the clinical and population level, and guideline recommendations should emphasize interventions on all CVD risk factors rather than on single risk factor.3
- In general, the benefits of interventions on particular risk factors are related more to the magnitude of the preintervention total CVD risk than to relative risk associated with a single, specific risk factor. Therefore, determination of total CVD risk is critical to recommendations on the effective and efficient management and control of CVD risk at both population and individual levels.
- Total CVD risk is a measure of the number of events in a defined population per unit of time (e.g., CVD events per 1000 in 55- to 64-year-old men per year). In effect, a total risk compares a person’s or population’s risk with a zero risk. The combined effects of all risk factors determine total CVD risk, and often, modest increases in multiple risk factors have a greater impact on CVD risk than a significant increase in just one risk factor.3
- For example, a 46-year-old woman with high blood pressure (170/100 mm Hg), but who is a nonsmoker, is nondiabetic, and has a total cholesterol level of 220 mg/dl and HDL cholesterol level of 60 mg/dl has an absolute CVD risk of 8/100 in 10 years. In contrast, a 62-year-old smoking man without diabetes and with a lower blood pressure (150/90 mm Hg) but with a slightly higher total cholesterol level (240 mg/dl) and a slightly lower HDL level (45mg/dl) has an absolute CVD risk of 40/100 in the next 10 years.3
- Moreover, although blood pressure–lowering drugs would reduce the relative CVD risk by at least one quarter in both patients, the woman’s risk would fall from 8% to 6% (i.e., a 2% absolute risk reduction in the next 10 years), whereas the man’s risk would fall from 40% to 30% (i.e., a 10% absolute risk reduction in the next 10 years).
- Although most patients like the first one would receive in concordance with national guidelines those like the second patient may not receive blood pressure–lowering drug therapy, because of the failure to appreciate the concept of total CVD risk.3
- Several risk factors that are only moderate often incur a greater total risk in the short term than does a single, severe risk factor. Risk assessment in both individuals and populations must take this fact into account. The greatest efficacy of treatment occurs in patients who are at highest risk.
- Compared with people without diabetes, women have 5-fold and men have 3-fold risk of CVD according to the latest data from SCORE.4 The risk is even greater in the presence of microalbuminuria (highest risk category, similar to a10-year risk SCORE of >10%.4
- Men with family history of premature CVD have two-fold increased risk and women have 1.7-fold increased risk of CVD.4
- Thus, persons who are at higher total risk will attain greater reductions in absolute risk with any given lowering of risk factors. Giving priority in risk-reduction therapies to patients at higher total risk will produce a substantial reduction in total CVD events.
- The number needed to treat over a given period of time to achieve prevention of one CVD event will be fewer in higher-risk persons than in lower-risk persons.3
- Among the several CVD risk prediction models, Framingham Risk Score (FRS) developed in the US and the SCORE developed in Europe are the most widely used. The FRS includes both fatal and non-fatal coronary events but not stroke, whereas SCORE includes only fatal CVD events.
- European SCORE data indicate that the total CVD event risk is about 3 times higher than the risk of fatal CVD so that a SCORE risk of 5% translates into a 15% total (fatal plus non-fatal) CVD end points.4
Sources
1. Lloyd-Jones DM. Cardiovascular risk prediction: basic concepts, current status, and future directions. Circulation. Apr 20 2010;121(15):1768-1777.
2. Califf RM, Armstrong PW, Carver JR, D’Agostino RB, Strauss WE. 27th Bethesda Conference: matching the intensity of risk factor management with the hazard for coronary disease events. Task Force 5. Stratification of patients into high, medium and low risk subgroups for purposes of risk factor management. J Am Coll Cardiol. Apr 1996;27(5):1007-1019.
3. Smith SC Jr, Jackson R, Pearson TA, et al. Principles for national and regional guidelines on cardiovascular disease prevention: a scientific statement from the World Heart and Stroke Forum. Circulation. Jun 29 2004;109(25):3112-3121.
4. Catapano AL, Reiner Z, De Backer G, et al. ESC/EAS Guidelines for the management of dyslipidaemias The Task Force for the management of dyslipidaemias of the European Society of Cardiology (ESC) and the European Atherosclerosis Society (EAS). Atherosclerosis. Jul 2011;217 Suppl 1:1-44.


